Economics Class 27
A BRIEF OVERVIEW OF THE PREVIOUS CLASS (05:04 PM)
NATIONAL INCOME- REVISION (05:06 PM)
- NDP at FC= 8000, NFIA= 200, un-disbursed profit= 1000, corporate tax= 500, Interest received by households= 1500, Interest paid by households= 1200, transfer income= =300, Personal tax= 500. Calculate Personal income.
- Personal Income= NDP at FC+ NFIA- Undistributed profit- Corporate tax- Net interest paid by households+ Transfer income
- Personal income= 8000+ 200- 1000-500-(-300)+300 = 7300
- Personal disposable income= Personal income- personal tax= 7300-500= 6800
- FAQs on National Income
- Free meals to beggars- Transfer payment- Not included in National income.
- Wages received by workers in the British Embassy- Part of National Income
- Purchase of vegetables by restaurant- Intermediate consumption- Not part of National Income
- Medical facilities for Government Employees- Part of National Income, as it is a part of Compensation to employees
- Government expenditure on Streetlight- Part of National Income, it is part of C+G+I+ (X-M).
- Bonus to employees- Part of National Income [* NI= CE+ MI+ OS. CE= Salary in cash, salary in kind]
- Interest paid by an individual to the loan is taken- Is not part of National Income as it is consumption. The person is taking loans for consumption and not for productive purposes.
- Free medical facilities by Employer- It is part of CE and thus part of the National Income
- Expenditure on the repair of fixed capital asset- It is an intermediate consumption, It is not buying of an asset, it is a kind of transfer- Thus it is not calculated in National Income
- Purchase of Books by student- Part of National Income (Part of private consumption)
- Purchase of a second-hand machine- Not included in national income
- Interest received on loans taken by the government- Not included in National Income
- Leave travel allowance paid to employees by the company- Included in National Income
- Direct purchases made by resident households- part of National Income
- Interest received on debentures/ bonds issued by debenture holder- This interest is part of National Income as here production activity is happening.
- [* The investment into bonds and shares are not part of I in G+ G+I +X-M, thus it is not included in National Income]
- Profits of reliance industries from its chemical business in Australia- Part of national income
- Payment of fees to a lawyer engaged by the firm- Not a Part of National income. A lawyer is not an employee of the firm, thus for the company, it is intermittent consumption.
SURVEYS FOR UNEMPLOYMENT (05:43 PM)
- Periodic Labor Force Survey
- PLFS is conducted annually to generate an estimate of labour statistics along with unemployment indicators.
- Employment Unemployment Survey (EUS) was conducted once in five years under the Ministry of Labor and Employment and PLFS is handled by NSO under the Ministry of Statistics and Programme Implementation.
- The first PLFS survey was conducted for the period 2017-18 using education levels as the criteria for stratification. There is also the use of technology for the survey i.e. World Bank Computer-assisted personal interview solution (CAPI).
- PLFS generated two types of data
- 1) Quarterly data on labour force participation and employment status for only urban areas using Current Weekly Status methods.
- 2) Annual data to measure the labour force estimate on key parameters in both usual status (Principle status + Subsidiary Status) and also Current Weekly Status for both rural and Urban areas.
LABOR FORCE PARTICIPATION RATE (LFPR) (06:04 PM)
- The labour force consists of a person who is of the age 15 or above and belongs to either of the following two categories (Employed+ actively looking for employment)
- The commonality between the above two categories is that they both have people demanding jobs. This demand is what labor force participation refers to.
- LFPR is the number of people aged 15 and above, who are employed or actively seeking employment divided by the Total non-institutionalized civilian working-age population
-
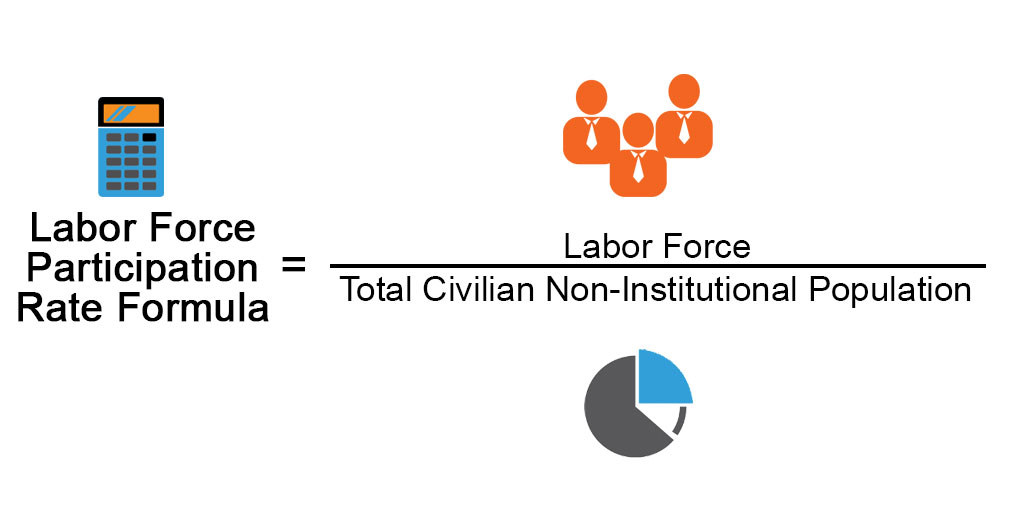
- In short, LFPR represent the demand for jobs in an economy
- Key findings of the PLFS Report 2019-20
- India's unemployment rate reduced to 4.8 % during 2019-20 from the previous 5.8% during 2018-19
- Urban unemployment reduced to 7% from 7.7 %
- Rural unemployment was reduced to 4 % from 5.1%.
- LFPR increased to 40.1% during 2019-20 from 37.5% in 2018-19
- The female labour force participation rate also improved to 22.8% in 2019-20 from 18.6 %.
REASONS FOR INDIA'S LOW LFPR (06:12 PM)
- According to CMIE as of December 2021, Male LFPR was 67.4% and Female LFPR was as low as 9.4%. In other words, less than 1 in 10 working-age women in India are even demanding work.
- According to the source data from the world bank, India's Female LFPR is around 25% when the global average is 47%. It is due to reasons like, law and order issues, lack of efficient public transportation, violence against women, Societal norms, etc.
OCCUPATIONAL STRUCTURE 2018-19 (06:16 PM)
- Primary sector: 42.2%
- Tertiary sector: 32.6%
- Secondary sector: 24.9%
- In rural areas, the work force is mainly engaged in the primary sector.
- In Urban areas, the workforce is mainly engaged in the tertiary sector.
- Overall the primary sector has the largest proportion of the workforce employed.
- The percentage of the female workforce engaged in the primary sector is 57.3 % whereas, for the male workforce, it is 45%
- Change in occupation structure
-
Sectors in Economy 1950-51 2019 Primary sector 72.7% 42.4% Secondary sector 10% 24.9% Tertiary sector 17.3% 32.6%
EMPLOYMENT TRENDS IN INDIA (06:31 PM)
- The overall employment elasticity ratio which was 0.52% during 1972-83 declined to 0.41% in the next 10 years and further to 0.29% 1994-2004 and during 2004-05 to 2011-12, employment elasticity declined to 0.04% i.e. Almost zero.
- Employment elasticity in agriculture which was 0.46 from 1973 to 1983 turned negative i.e. -0.42 during 2004-05 to 2011-12 leading to Structural Change.
- This absolute decline of workers in Indian agriculture after 2004-05 occurred for the first time in Indian post-Independent economic history and it is indicative of structural transformation.
- The sector which registered the fastest growth of employment in the recent past is the construction sector. This structural shift can be accounted to new economic reforms in 1991.
- The increased share of industry or the secondary sector in total employment is mainly the result of massive expansion in the construction sector, however, the quality of employment is not good as most of the workers have casual jobs.
- The backbone of industrial and economic progress i.e. Manufacturing continues to face stagnation. According to 2011-12 data this sector could employ only 12.8% of the total workforce. Without rapid growth of the manufacturing sector, the country will not be able to push economic growth to any significant height.
- Summary of the challenges-
- License raj, Industrial policy, Public sector being the main driver i.e. PSU led growth, Power deficit during second FYP, Challenges with respect to land acquisition, Industrial policy in the 1960s i.e. Import substitution along with protection to Small scale industries, Structural change & Competition, Abrupt jump from Agriculture to services
- Steps were taken- MUDRA scheme; Liberalised Labor laws; Aatmanirbhar Bharat package I, II, III, etc.
CASUALIZATION AND IN FORMALIZATION OF WORKFORCE (06:47 PM)
- Angel Tax
- Due to the variation in the valuation of the company, this tax was levied.
- Suppose a startup is valued at 1000cr due to its growth potential, innovative steps, New ideas, etc and the angel investor invested 500cr and acquired 50% stake. But from the government point of view, the valuation of the company is 500cr so for acquiring the 50% stake one has to pay 250cr only.
- So the additional 250cr will be seen as an income and will be taxed. And this tax is called as Angel Tax
- CASUAL V/S REGULAR WORKERS (07:15 PM)
- Hired workers are categorized as casual workers and regular workers
- Casual workers work on daily wages and are not given all social security benefits like pensions. However, they are entitled to regular working hours and even overtime payment.
- Regular workers are on a permanent payroll and are entitled to all social security benefits.
- Formal worker v/s Informal worker
- As per the National Commission for Enterprises in the organized sector, NCEOS, Workers working in the organized sector which includes government departments, public enterprises, and private establishments hiring 10 or more workers are termed formal workers.
- However, workers working in the unorganized sector i.e. enterprises hiring less than 10 workers are called informal workers.
REASONS FOR INCREASED CASUALIZATION (07:20 PM)
- Informalization led to the casualization of the workforce.
- Migration of disguised employed rural workers to urban areas in search of non-farm employment where they get employed as casual workers due to lack of proper skills and training.
- Due to rapid growth in the real estate sector in Urban areas and MGNREGS in rural areas.
- Reasons for increased Informalization
- Globalization and transition to a market economy
- Increase in the Gig Economy (Freelancers)
- MSME turning out to become Dwarf (10 years in existence but less than 100 permanent jobs)
- Over-tertiarization.
- Increase in the Real estate construction sector.
- Challenges of stringent labour laws
- Increase in outsourcing/ Subcontracting
- Data related to casualization
- The percentage of casual workers increased from 23% in 1972-73 to 33% in 1999-2000 and further to 39.3% in 2009-10 which reduced to 24% by 2018.
- The percentage of self-employed workers in the workforce declined from 62% in 1972-73 to 51.9% by 2018.
- The percentage of regular workers has slightly increased over time. 15% in 1972-73 to 24.1% in 2017-18
EMPLOYMENT STRATEGY DURING POST REFORM PERIOD (07:29 PM)
- It is often rightly argued that a high rate of economic growth is necessary but not a sufficient condition to solve the unemployment problem in India.
- In India where employment elasticity is quite low, an annual growth rate of 8-9% can only provide a partial solution to the unemployment problem, therefore under the 8th Five-Year plan, there was an emphasis on both growth and also the restructuring of output composition of growth.
- The plan sets a target of 2.6-2.8% annual growth in employment with a view to achieving near-full employment in a period of 10 years, therefore, the government started focussing on sectors and sub-sectors with high employment elasticity. Example- Rural non-farm sector, promoting small and decent industrial sector, faster growth of services sector, etc
- The 9th five-year plan emphasized the need for providing productive work as it is the basic source of dignity and self-respect. The importance of public intervention was recognized to not only ensure adequate work opportunities but also enable the labour force to access these opportunities.
- The 11th five-year plan aimed at creating 58 million job opportunities, most of the observers agreed that the post-economic reform period has witnessed jobless growth.
- The largest sector of the economy started declining and government programs for poverty reduction were ineffective due to leakages. The jobless from the rural areas entered the informal sector characterized by unprotected jobs without regular salaries and social security.
- The workers migrated to big cities and ended up in slums living in sub-human conditions
- The 12th five-year plan decided to make the manufacturing sector a genuine engine of growth that could generate 100 mn work opportunities by 2022. The 12th five-year plan also focused on food processing industries, and textiles along with a skill development program.
RECENT INITIATIVES (UPDATE ) (07:41 PM)
- Aatmanirbhar Bharat Rozgar Yojana 3.0- Announced by GoI to boost employment generation and minimize the socioeconomic impact of COVID-19. It focuses on formalization, and creating new employment opportunities during the post-pandemic period.
- Under Pradhan Mantri Kaushal Vikas Yojana (PMKVY), the government provides 300 skill courses to equip youth with employable skills.
- PM DAKSH, portal, and App to make skill development schemes accessible to targeted groups.
- SMILE, Support for Marginalized Individuals for Livelihood and Enterprise
- Startup Scheme, Standup Scheme, MUDRA scheme, MGNREGS.
- Note- Update
INFLATION (07:48 PM)
- Framework
- What is inflation?
- Types of inflation- Creeping, walking, hyperinflation
- Demand-pull, Cost-push
- Reasons for demand pull and cost push
- Measurement of Inflation- WPI, CPI, GDP Deflator
- Base year and Base effect
- The divergence between WPI and CPI
- Deflation, Disinflation, Stagflation
- Impacts of different aspects on Inflation- Impact of inflation on bond yield, inflation-wage spiral.
- Measures taken by the government-
- Rural and Urban inflation
- Headline and core inflation
OBSERVATION OF INFLATION IN THE RECENT PAST (07:55 PM)
- After the lockdown, the Government came up with an expansionary fiscal policy and RBI came up with an expansionary monetary policy. But people were hesitant to spend money due to uncertainty.
- When people will not be spending then there was low pent-up demand. After the relaxation of the lockdown, the demand increased. Sudden demand increase led to demand-pull inflation.
- Chinese Zero covid policy disrupted the supply chain and the Russia-Ukraine war also led to cost-push inflation. Also, rainfall and drought-related issues created structural problems and inflation increased.
- Under these circumstances, inflation went up to 7.9 %. In the developed world also Inflation increased and touched double digits also.
- All countries adopted contractionary policies.
- India started Imported Inflation and the Government increased the customs duties.
The topic for the next class:- Inflation, Types of Inflation, Cost-push and Demand-pull Inflation and their causes.